
INSIGHTS, NEWS & INNOVATIONS
Conservation Technology Newsblog.
Stay informed on the latest breakthroughs, stories and innovations, driving change in nature conservation and wildlife protection.
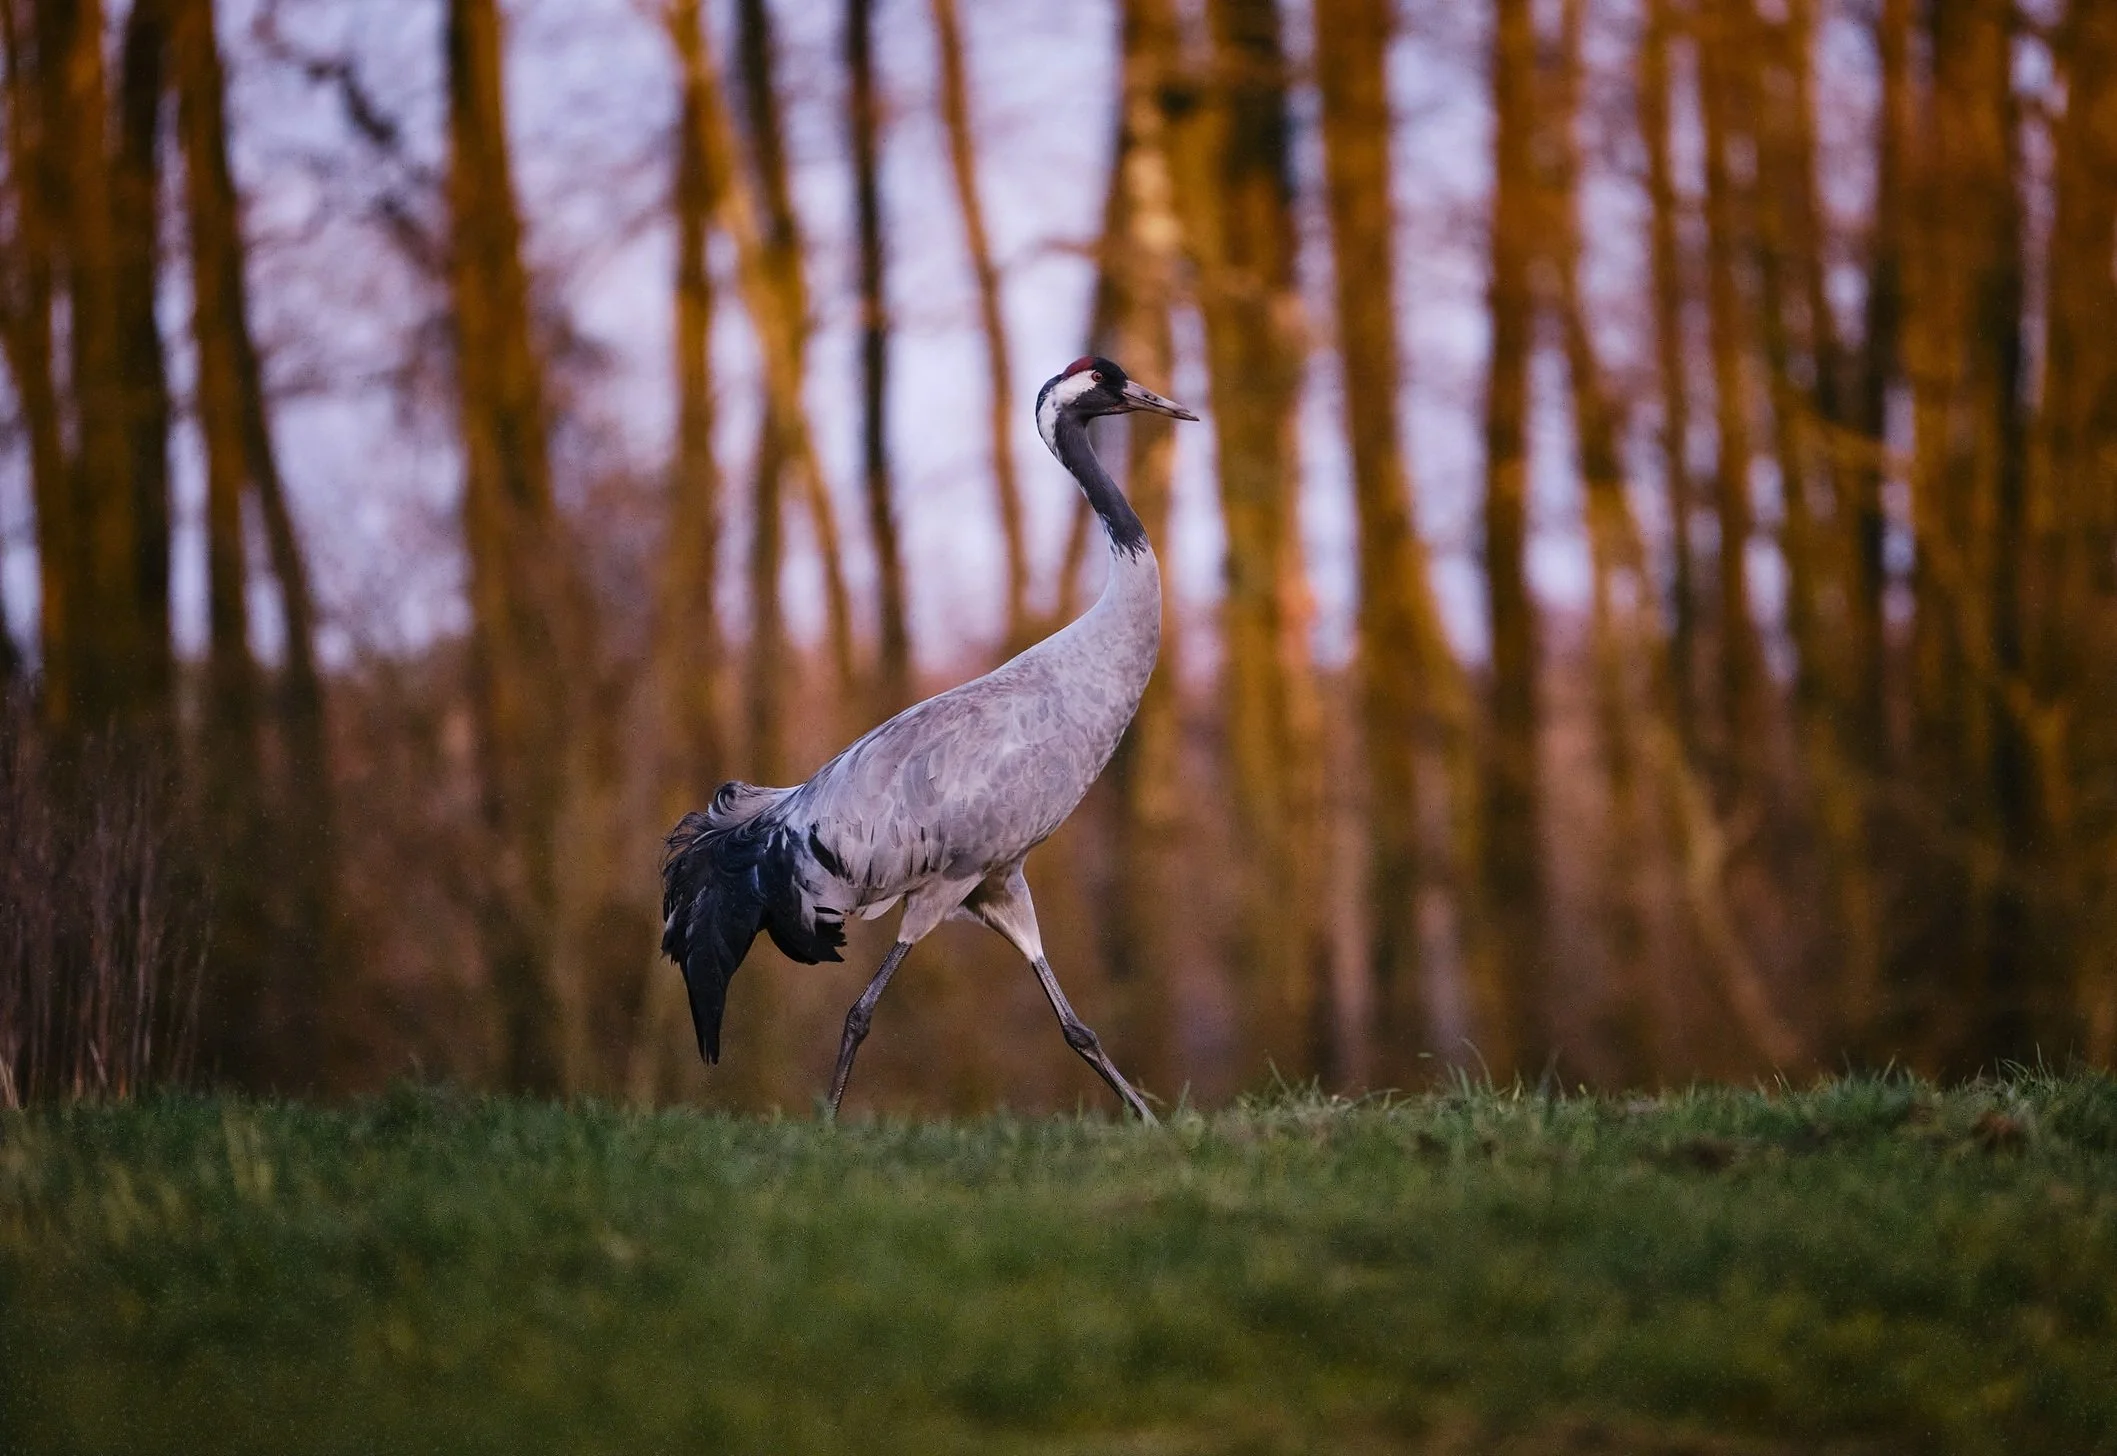
VOORJAARSTREK VAN KRAANVOGELS, CO-CREATIE, HACKATHONS EN NIEUWE RADARFUNCTIES
Vanuit het bureau van Dr. Koen de Koning: Laatste nieuws en inzichten
SPRING CRANE MIGRATION, CO-CREATION, HACKATHONS, AND NEW RADAR FEATURES
From the desk of Dr. Koen de Koning: Latest news & insights
BUILDING THE NEXT CHAPTER OF THE CRANE MIGRATION RADAR
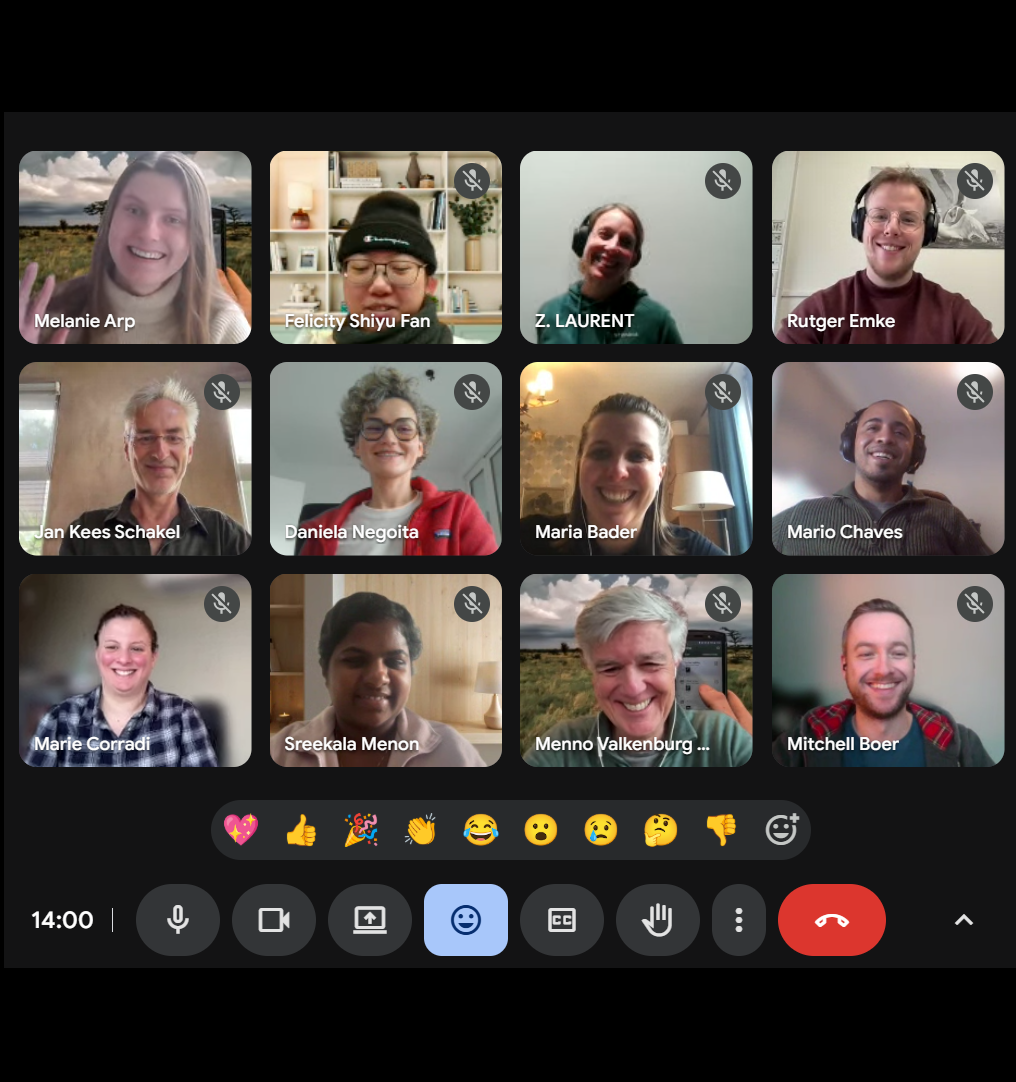
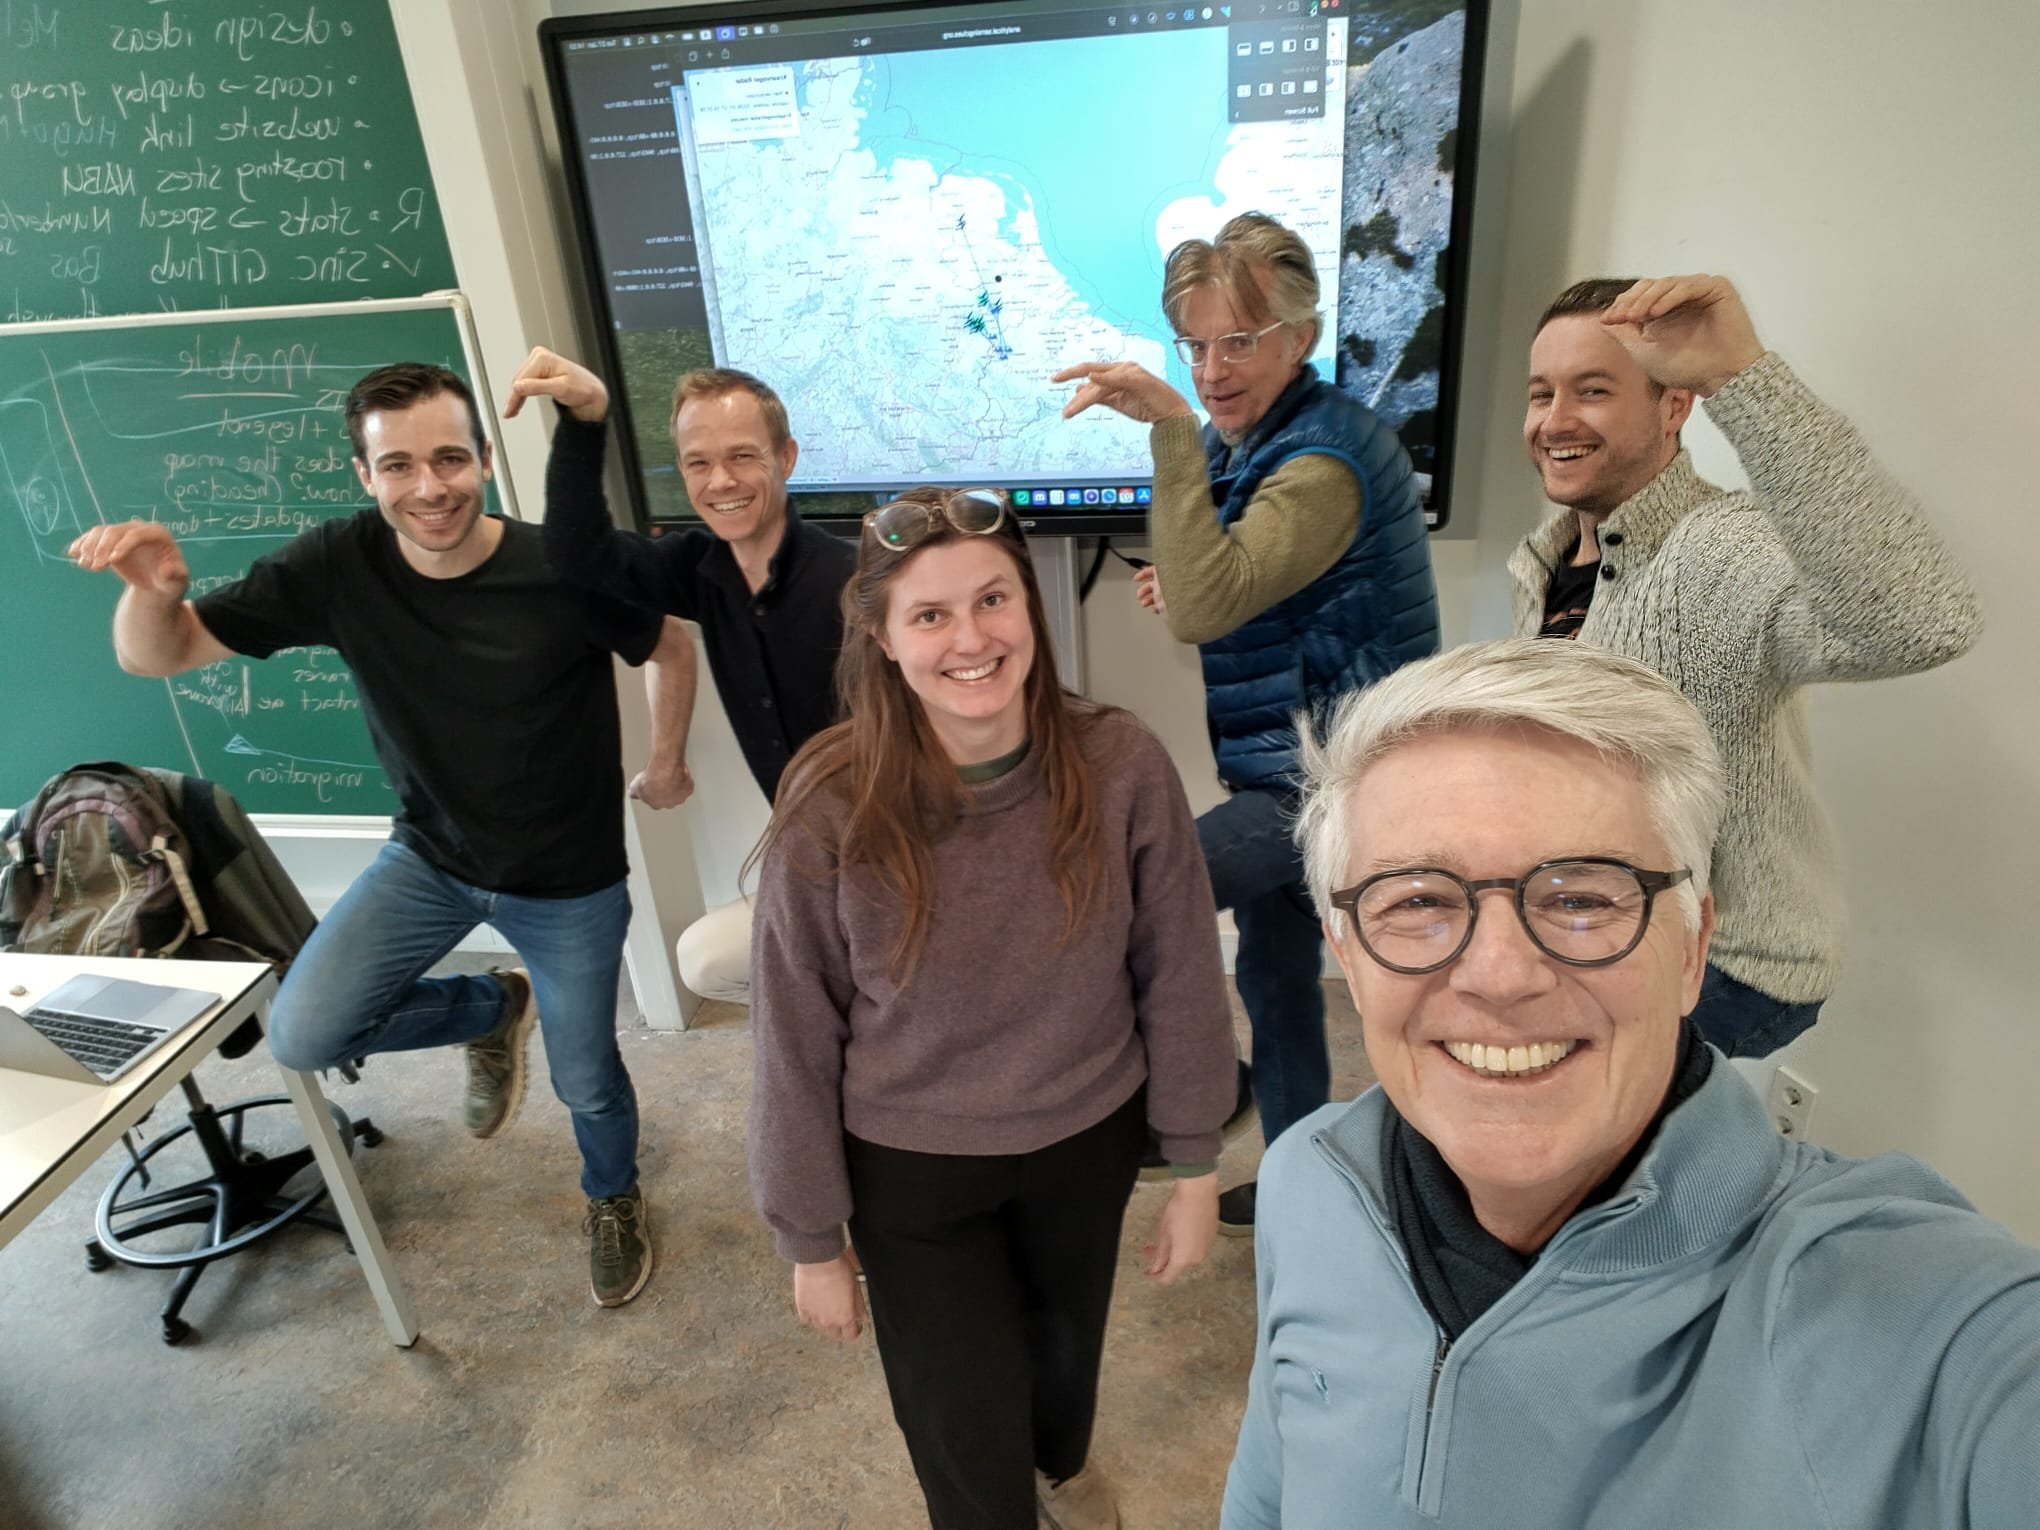
Hybrid Hackathon on 27 January 2026


MANAGE IT ALL WITH SENSING CLUES CENTRAL!
Smarter Tools. Stronger Collaboration. Greater Impact.
HERFSTMIGRATIE VAN DE KRAANVOGELS, DE SPLINTERNIEUWE VIRTUELE KRAANVOGEL EN HOE U KUNT MEEDOEN
Vanuit het bureau van Dr. Koen de Koning: Laatste nieuws en inzichten
AUTUMN CRANE MIGRATION, THE BRAND-NEW VIRTUAL CRANE, AND HOW YOU CAN GET INVOLVED
From the desk of Dr. Koen de Koning: Latest news & insights


SENSING CLUES FEATURED IN UBUNTU MAGAZINE
Highlighting our mission to support conservation through smart technology

Nature FIRST Conference Panel Discussion
From Tools to Action – Scaling Conservation Solutions for Global Impact


THE ROAD TOWARDS PREDICTING STURGEON MIGRATION
12.06.2025
Learn how to transform data into impactful action for sturgeon conservation in this webinar


CONSERVATION COMMUNICATION THAT WORKS
24.04.2025
Clear messages, local voices, and media-smart strategies
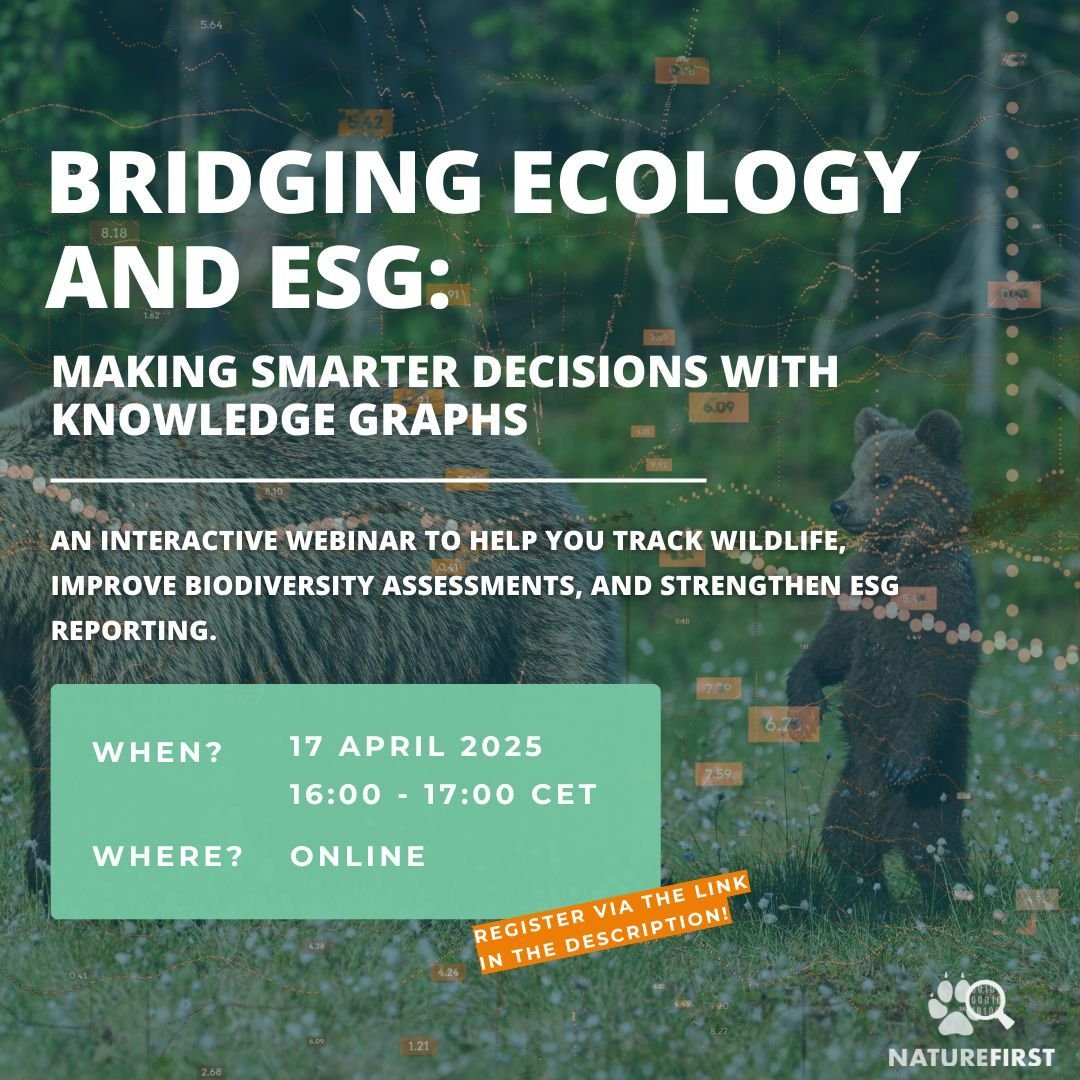
BRIDGING ECOLOGY AND ESG
17.04.2025
Discover how to make smarter decisions with Knowledge Graphs in this live session
LENTE KRAANVOGEL MIGRATIE, NIEUWE KRAANVOGELRADAR FUNCTIES EN INSPIRERENDE STUDENTENPROJECTEN
Van het bureau van Dr. Koen de Koning: Laatste nieuws en inzichten
SPRING CRANE MIGRATION, NEW CRANE RADAR FEATURES, AND INSPIRING STUDENT PROJECTS
From the desk of Dr. Koen de Koning: Latest news & insights

TRACKING CHANGE: ENVIRONMENTAL TIME SERIES
30.04.2025
Discover the power of satellite data to track landscape changes in this webinar