
It all starts with downloading the Cluey Data Collector app from the Google Playstore and creating your personal account. Once you did, and you recorded one or more tracks and observations, you can use the tools below to analyse your data and to create related statistics and maps.
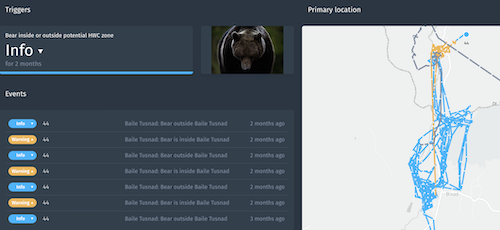
Instant overview of where all your people and assets are and when, what and possibly who they’ve recorded.
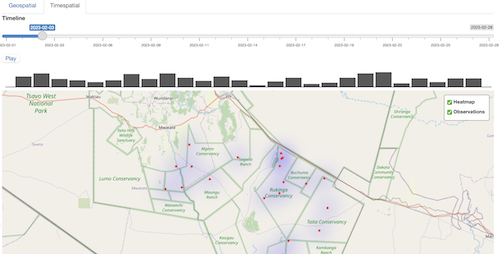
Real-time as well as historic. Read more

MAP generators
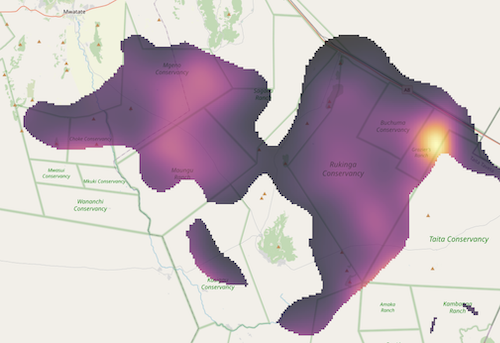
Create likelihood maps for any subject or combination of subjects. Orange represents a high likelihood. Black a low likelihood.
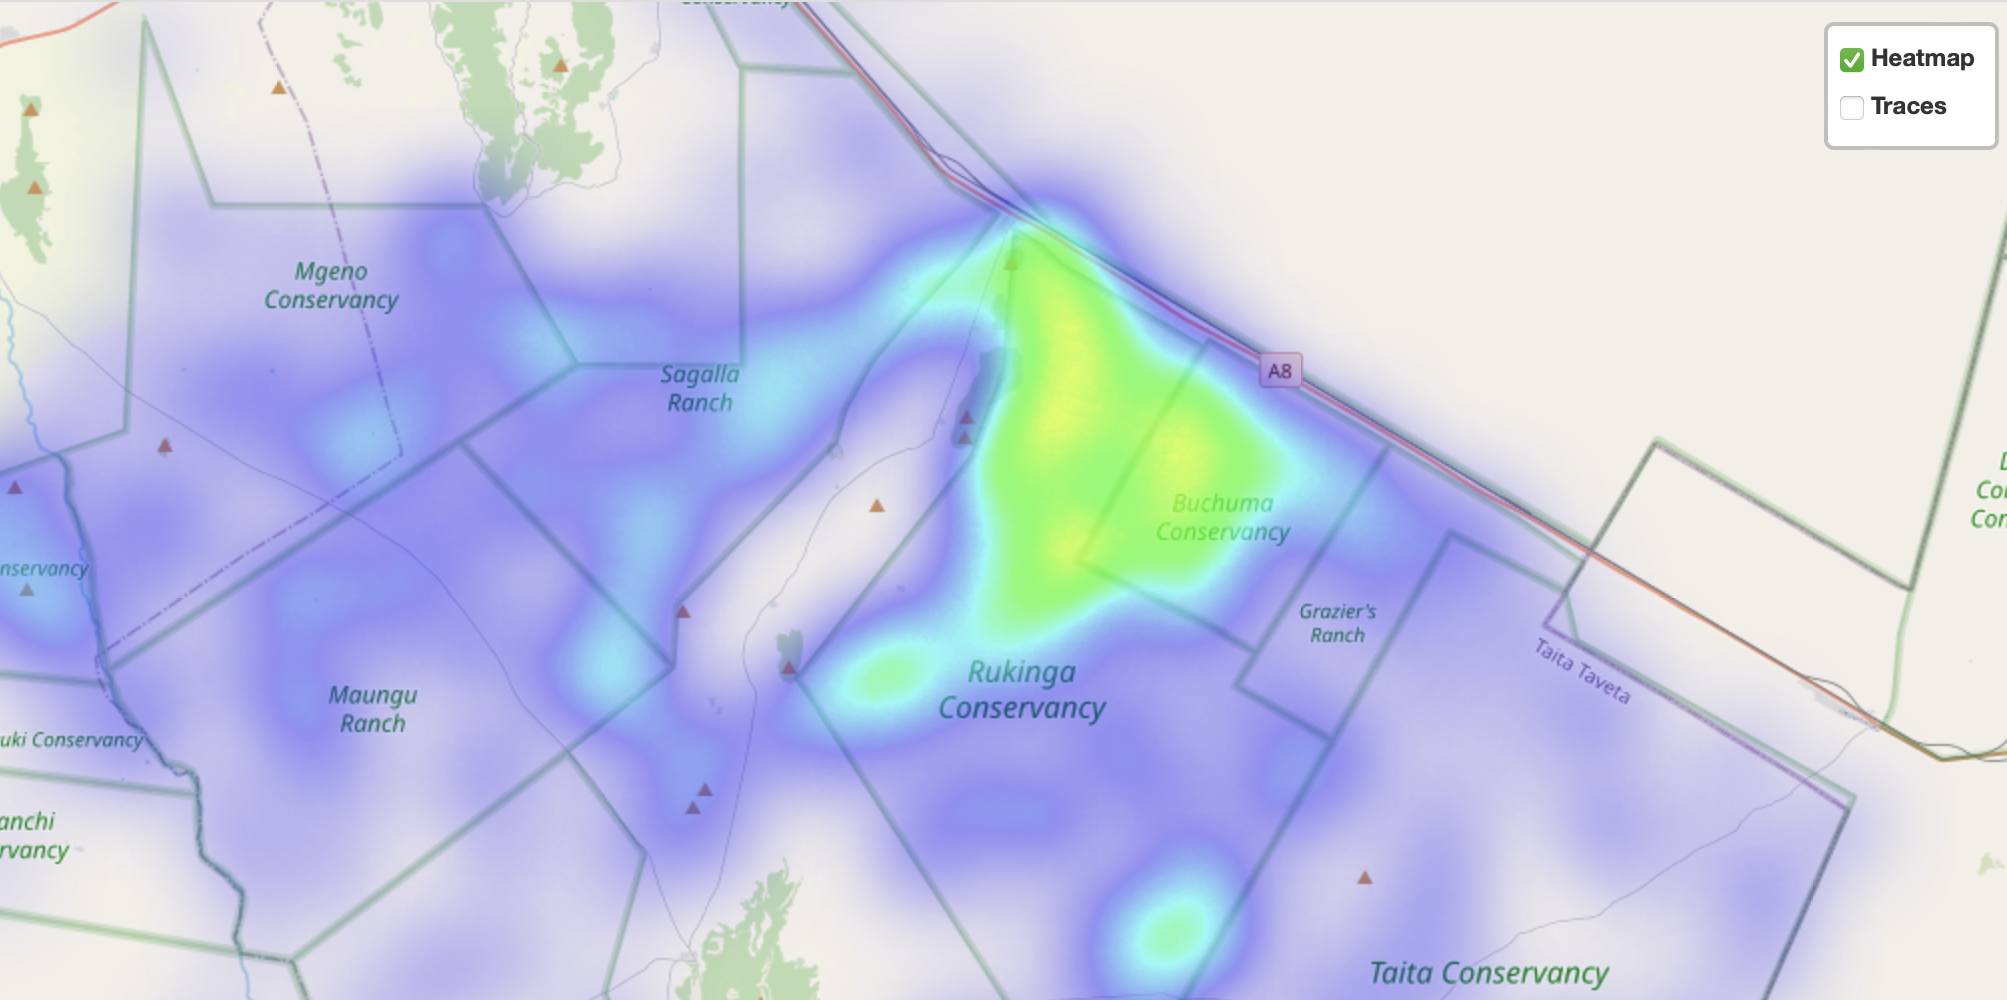
Create heat map (also known as hotspot maps) for any subject or combination of subjects. Orange represents places where many have been recorded. Blue where few have been recorded. Read more
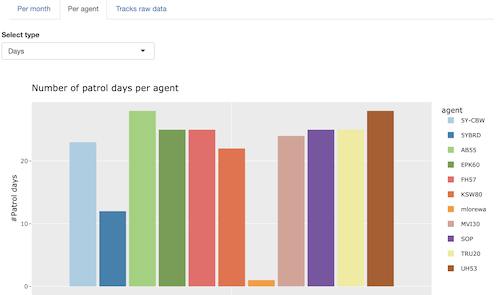
Create patrol density map for foot patrols, vehicle patrols, snare-sweep patrols, etc., or any combination thereof. Read more
REPORTS


tools for specialists
More info follows soon!
More info follows soon!

More info follows soon!
